› Create a project tracker for Cadence, a product design studio in Lisbon. Each task has a title, a short description, a status, a priority, an assignee, a project name and a due date. Include a dashboard page showing how many tasks sit in each status alongside recent activity, a task list page with a search and a status filter, a task detail page, and a page for adding a new task
Follow these steps in the Beetler builder to reproduce this exact app. Button and chip names are written the way they appear on screen.
- Pick the build type.On the home screen, under “What are you building?”, click the Web app chip.

- Describe the app and its fields.Name the fields on a record — a title, a short description, a status, a priority, an assignee, a project name and a due date. status and priority are the load-bearing words: Beetler turns them into enums, and an enum is what the dashboard counts and the list filters by. Drop them and you get a flat list with nothing to group.
- Choose a tone.Under “App personality”, click Business. It resolves to a compact, cool-neutral spec: slate header, restrained accent, Inter throughout, tighter spacing than the other recipes. A tracker is read at a glance, so density is the design.

- Click Build It — then take the AI path.Beetler may match one of its stock templates and build it instantly for free. That template is not your app: click Use AI instead and the six-stage pipeline reads your actual paragraph. That is what produces a Task entity with your fields rather than a shop's Product.

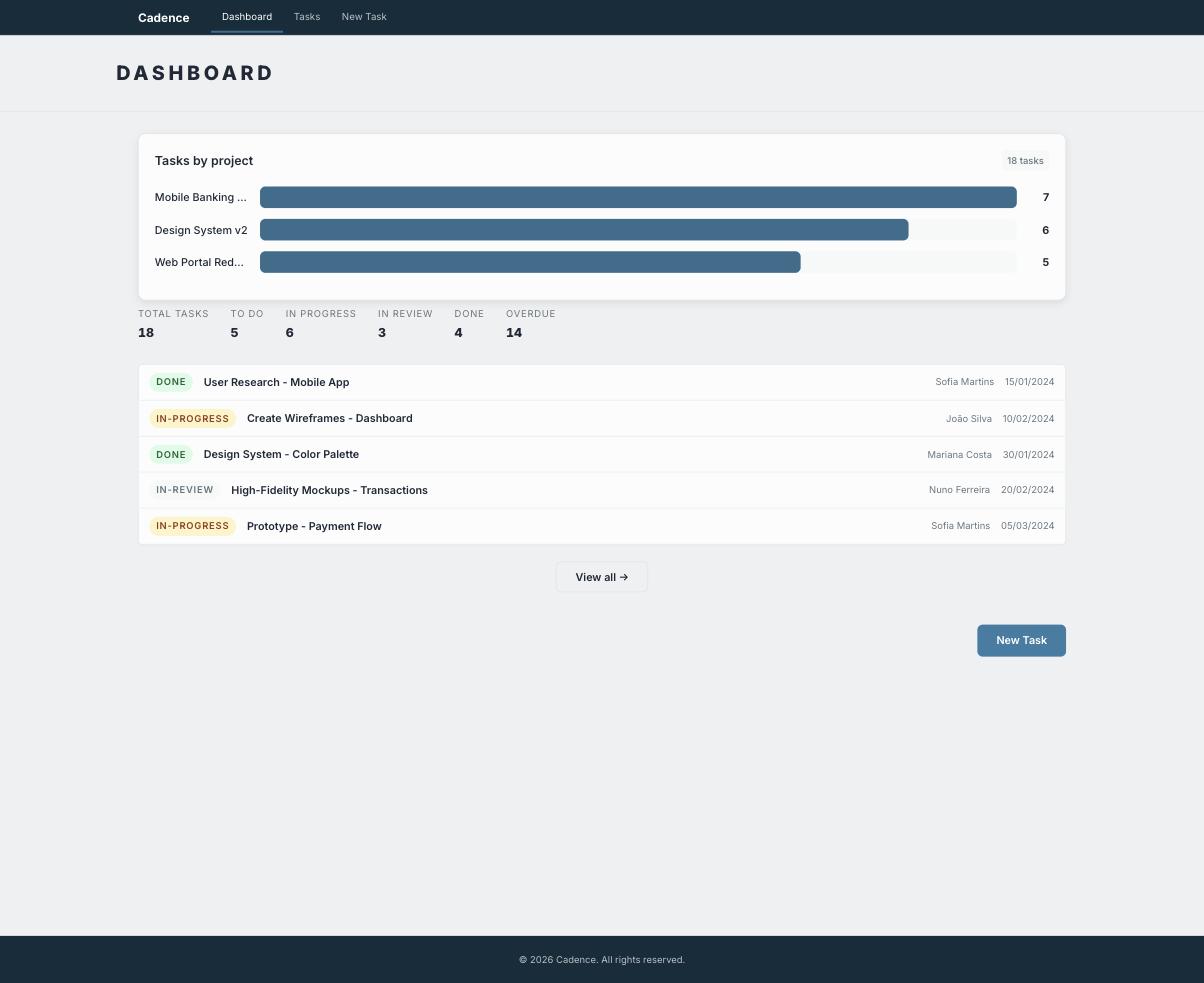
- Watch it lay out the tracker.Four pages — Dashboard, Tasks, Task Detail and New Task — with the dashboard already showing a count per status and an overdue tally it derived from the due date.
- Fill it with work.Click Data then Generate Data. Set Task to 18, Project to 4, and add two assertions:The second assertion is what stops the generator writing “Task 1, Task 2”. Click Generate, then Accept & Save.Eighteen tasks spread across four projects, with a realistic mix of statuses so no status is empty, and due dates through 2026
Tasks are real product design studio work in English (research, wireframes, design system, handoff), assignees have Portuguese names - Build the chart widget.Open Widgets in the header and describe the graph you want: a horizontal bar chart showing how many tasks each project has, one row per project, the count at the end of the bar, using CSS variables for every colour. Beetler asks four design questions — bar scaling, sort order, empty state, animation — then writes the component in inline SVG. No chart library is involved, so it inherits your app's theme automatically.
- Point the chart at your real tasks.Iterate in the same chat: compute the chart from the data prop instead of fixed numbers — group the rows by projectName and count them. Widgets receive the app's own records in a data prop, so the chart stays true as tasks change. Click Publish when the preview looks right.
- Place it on the dashboard.Back in the app, type place the WorkloadChartWidget on the Dashboard page. Then My Apps → Rebuild → Just Rebuild so the page picks the widget up.
- Publish or export.Open My Apps and click Publish for a shareable link with a QR code, or Source to take the standalone React project away as a zip.
Type pairing
HeadingInter
BodyInter
What Beetler filled in
PagesDashboard, Tasks, Task Detail, New Task
Tasks18 across three projects, five statuses
Dashboardcount per status + overdue, derived from the due date
WidgetWorkloadChartWidget — inline SVG, reads the tasks
The finished app
More recipes
Recipe A · Web app
TasteBud — a restaurant that takes bookings
A menu with real food photography and a working reservations flow.
See how it was built ↗
Recipe B · Slide deck
TasteBud — the pitch deck
One outline becomes eight designed slides in the Luxe style.
See how it was built ↗
Recipe C · Infographic
Beetler by the Numbers
Prose figures become stat tiles and an animated bar chart.
See how it was built ↗
Recipe D · Web app
Maison Aurele — a Paris atelier online
Sixteen photographed pieces in ink and champagne, priced in euros.
See how it was built ↗
Recipe E · Web app
Vela Studio — a studio that takes bookings
Twelve classes, five instructors and a booking flow in eucalyptus and coral.
See how it was built ↗
Recipe F · Web app
Meridian Journal — a magazine that reads
Twelve photographed essays from twelve countries, ink on paper.
See how it was built ↗