› Create a subscription analytics dashboard for Tidemark. Each monthly record has the month, the monthly recurring revenue in pounds, the number of active accounts, the churn rate as a percentage, the number of new signups and a short note on what moved that month. Include a dashboard page showing the headline numbers with recent months, a months page listing every month with a search, a month detail page with the full note, and an about page
Follow these steps in the Beetler builder to reproduce this exact app. Button and chip names are written the way they appear on screen.
- Pick the build type.On the home screen, under “What are you building?”, click the Web app chip.

- Describe one row, not the dashboard.The instinct is to describe the tiles you want. Describe the record instead — the month, the revenue, the active accounts, the churn rate, the signups and a note — and let Beetler derive the tiles. One entity with six honest fields beats four invented KPI entities that never agree with each other.
- Choose a tone.Under “App personality”, click Editorial. Analytics tools default to dense monospaced grids; Editorial gives hairline rules, airy spacing and Playfair Display numerals, so the figures read like a printed report. Same data, completely different room.

- Click Build It — then take the AI path.If a stock template is matched and built instantly, click Use AI instead so the pipeline reads your paragraph and produces the Month entity.

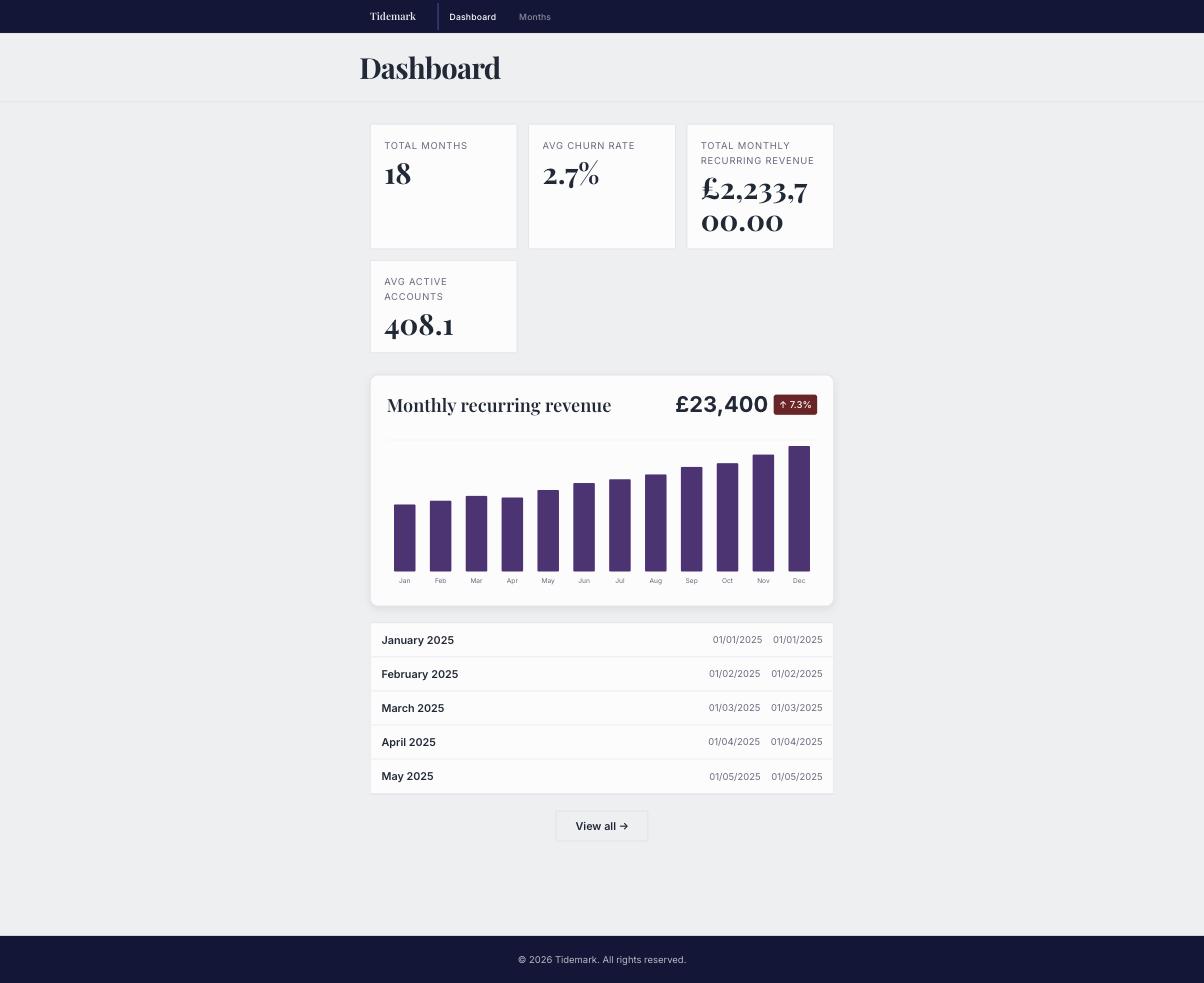
- Watch it lay out the dashboard.Four pages — Dashboard, Months, Month and About. Beetler picks the stat tiles from the field types: it sums the money, averages the rate and shows it as a percentage, and counts the rows.
- Fill it with eighteen months.Click Data then Generate Data. Set Month to 18 and add three assertions:The dip in the second assertion is deliberate: a chart where every bar is taller than the last looks fake. Click Generate, then Accept & Save.Eighteen consecutive months from January 2025 to June 2026, the month field written like January 2025
Monthly recurring revenue grows from about 48000 to about 214000 pounds but not every month goes up — two or three months dip
Churn rate stays between 1.8 and 5.4 percent, new signups between 40 and 320 - Set currency & region.Click Locale, set Currency to GBP and Date format to UK / Europe, then Apply Locale Settings.
- Build the revenue chart.Open Widgets and describe it: a column chart of the last twelve months of recurring revenue, one bar per month, the latest figure and its change against the previous month in the header, CSS variables for every colour. Say explicitly that it reads a data prop and takes
data.months— that is what makes the chart follow the records instead of numbers you invented. - Iterate until the axis is readable.Ours came back with twelve month labels overlapping into a smear, then squeezed into the middle of its box. Both were fixed by describing the geometry: a fixed viewBox of 0 0 720 260, the svg at width 100%, one column slot per month, each label centred under its bar at font-size 11. Then Publish.
- Place it and rebuild.Back in the app, place the widget on the Dashboard, then My Apps → Rebuild → Just Rebuild. The chart now draws itself from the eighteen months you generated.
- Publish or export.Open My Apps and click Publish for a shareable link with a QR code, or Source to take the standalone React project away as a zip.
Type pairing
HeadingPlayfair Display
BodyInter
What Beetler filled in
PagesDashboard, Months, Month, About
Months18, January 2025 to June 2026
Tilesrevenue summed, churn averaged as a %, accounts averaged
WidgetMonthlyRevenueChart — inline SVG, reads the months
The finished app
More recipes
Recipe A · Web app
TasteBud — a restaurant that takes bookings
A menu with real food photography and a working reservations flow.
See how it was built ↗
Recipe B · Slide deck
TasteBud — the pitch deck
One outline becomes eight designed slides in the Luxe style.
See how it was built ↗
Recipe C · Infographic
Beetler by the Numbers
Prose figures become stat tiles and an animated bar chart.
See how it was built ↗
Recipe D · Web app
Maison Aurele — a Paris atelier online
Sixteen photographed pieces in ink and champagne, priced in euros.
See how it was built ↗
Recipe E · Web app
Vela Studio — a studio that takes bookings
Twelve classes, five instructors and a booking flow in eucalyptus and coral.
See how it was built ↗
Recipe F · Web app
Meridian Journal — a magazine that reads
Twelve photographed essays from twelve countries, ink on paper.
See how it was built ↗