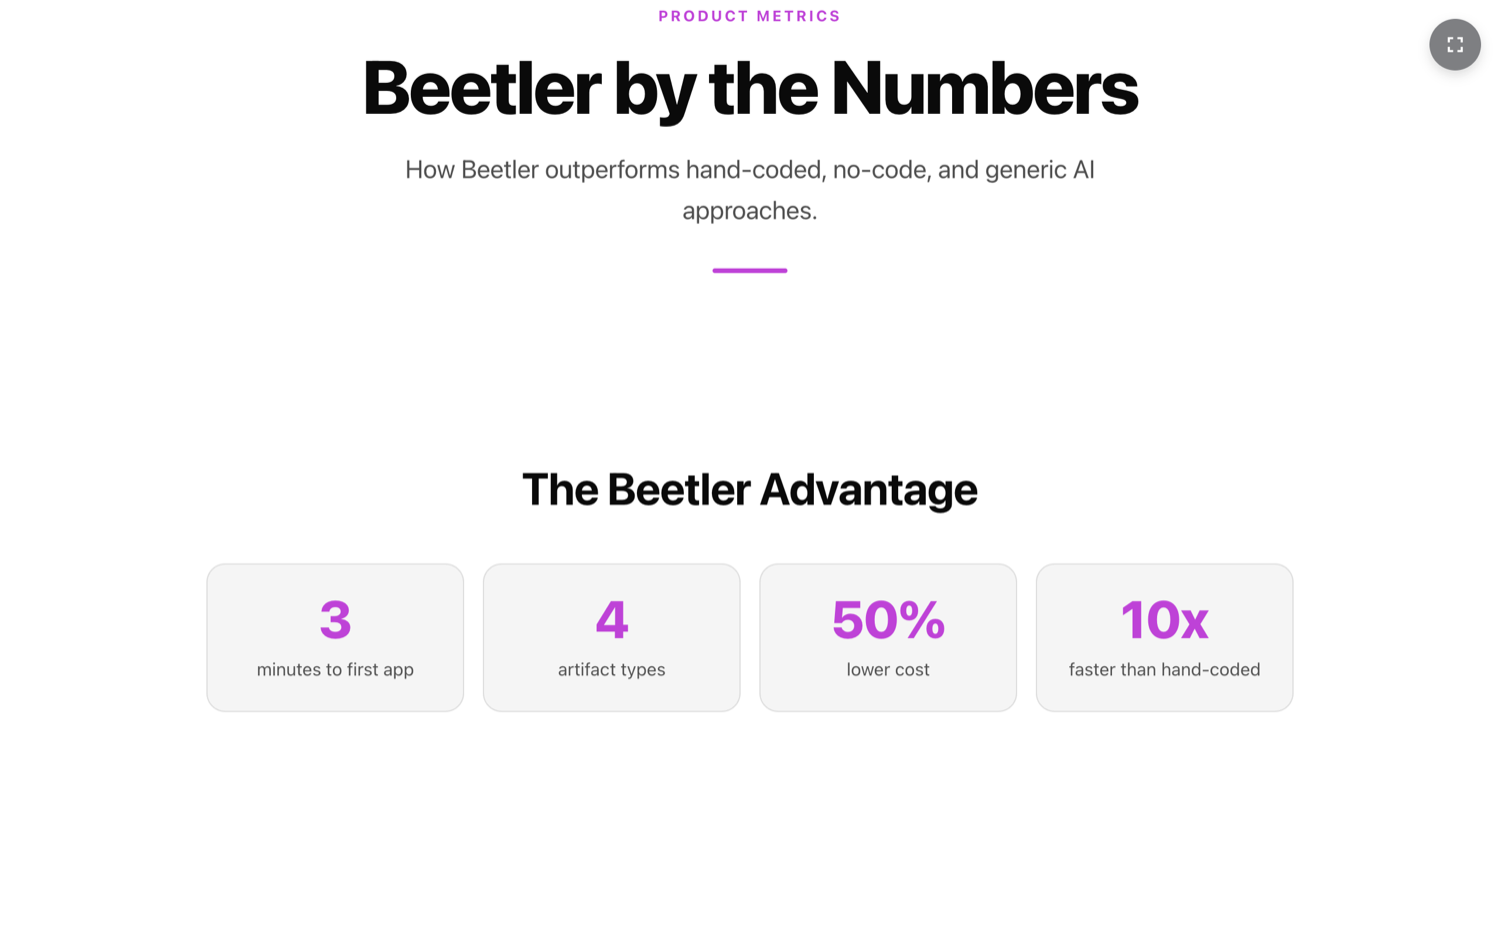
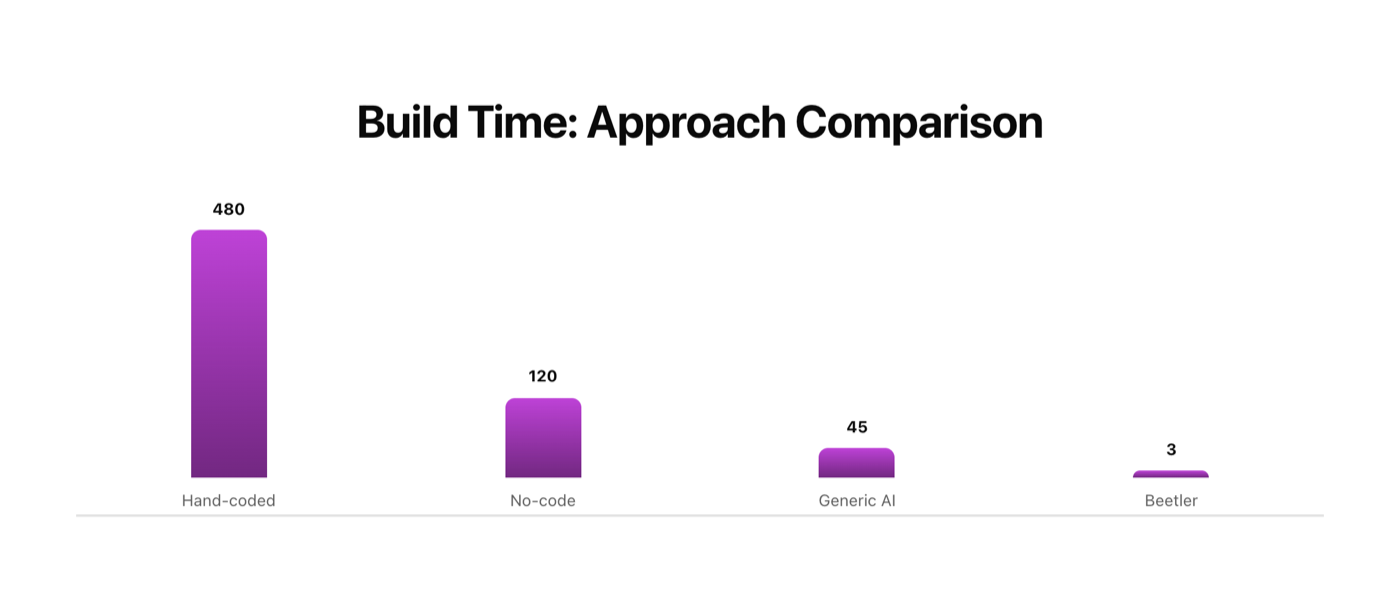
› An infographic titled "Beetler by the Numbers" showing key stats: 3 minutes to first app, 4 artifact types, 50% lower cost, and a bar chart comparing build time across hand-coded, no-code, generic AI, and Beetler.
Follow these steps in the Beetler builder to reproduce this exact infographic. Button and chip names are written the way they appear on screen.
- Pick the build type.On the home screen, under “What are you building?”, click the Infographic chip.

- Type the figures.Paste the sentence above into the prompt box. Keep the numbers and the comparison in plain English — Beetler parses them.
- Click Build It.Beetler reads the numbers, decides which are headline stats versus chart data, and builds an eyebrow, a hero, four stat tiles — 3 minutes, 4 artifact types, 50% lower cost, 10× faster — plus a build-time bar chart and supporting sections. There's no data step; you brought the numbers.

- Reflow in the Sections panel.Click Sections (the panel is labelled “Sections” for pages and infographics) to reorder, add or remove any block — hero, stat grid, chart, comparison table.
- Publish.Click Publish for a share link and QR code. As visitors scroll, the figures count up and the bars grow.
The finished infographic
More recipes
Recipe A · Web app
TasteBud — a restaurant that takes bookings
A menu with real food photography and a working reservations flow.
See how it was built ↗
Recipe B · Slide deck
TasteBud — the pitch deck
One outline becomes eight designed slides in the Luxe style.
See how it was built ↗
Recipe D · Web app
Maison Aurele — a Paris atelier online
Sixteen photographed pieces in ink and champagne, priced in euros.
See how it was built ↗
Recipe E · Web app
Vela Studio — a studio that takes bookings
Twelve classes, five instructors and a booking flow in eucalyptus and coral.
See how it was built ↗
Recipe F · Web app
Meridian Journal — a magazine that reads
Twelve photographed essays from twelve countries, ink on paper.
See how it was built ↗
Recipe G · Web app
Kite Property — a Copenhagen estate agency
Twelve photographed homes priced in kroner, with a type filter.
See how it was built ↗